Why the Lenstip reviews differ from others?
1. Where could the differences stem from?
The first of the lenses, mentioned above, proved to be a perfect piece of equipment to show the discrepancies between the Lenstip.com test procedures and those used by other editorial offices because of its untypical construction and interesting results. Although in the case of typical instruments the differences in procedures not always yield totally different results, in the case of untypical devices those discrepancies can be significant.
Let’s start by reminding the general rules we observe during our tests. Before we begin any test a lens is examined very carefully and cleaned (if it needs cleaning of course). Then the lens is attached to a reflex camera and put on a solid tripod. Smaller devices, up to 200 mm focal length, which are also physically lighter, are tested on the Gitzo GT2941 tripod and the Manfrotto 410 head. Heavier instruments need a better support so they are attached to the Gitzo GT5530S with the Gitzo G1380 head. We also use an appropriate cable release or a remote control and, in the case of reflex cameras, the mirror lock up function.
Please Support UsIf you enjoy our reviews and articles, and you want us to continue our work please, support our website by donating through PayPal. The funds are going to be used for paying our editorial team, renting servers, and equipping our testing studio; only that way we will be able to continue providing you interesting content for free. |
- - - - - - - - - - - - - - - - - - - - - - - - - - - - - - - - - - - - - - - - - - - - - - - -
We have resolution charts in four sizes at our disposal in the editorial office. They are necessary if you want to change the distance between a lens and its target so you can describe the lens’s optical properties better. That fact already can be the source of differences between the Optyczne.pl results and those shown by other editorial offices. While we work out an average of measurements often taken on three charts of different size and they get results based on one chart only, the differences might be sometimes significant. Apart from that, some funny problems might occur as in the case of one Polish web portal which, testing an 18-200 mm lens, had to start from the focal length near 30 mm because it was impossible to test shorter focal lengths due to too small test chart…
Our chart is special, different from a typical chart used by many websites and magazines. Firstly it is printed on a special foil which allows us to measure the real resolution value up to 4000 LWPH. Many other testing teams still conduct tests using older charts with the resolution up to 2000 LWPH. The chart used by us was also slightly modified so it is possible to determine the resolution in the frame centre, on an APS-C/DX sensor’s edge and on full frame edge at the same time.
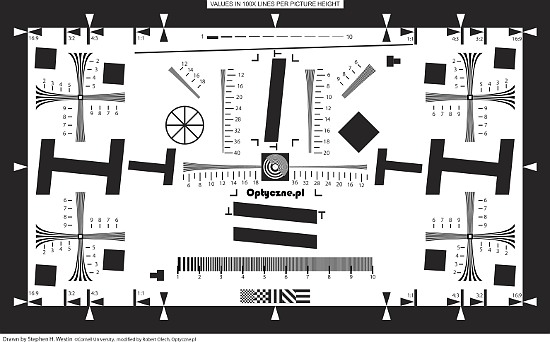
Our new chart which is used to test image resolution |
It’s also worth emphasizing here that the “frame centre” doesn’t mean an exact geometric midpoint. The resolution measurement areas have been delicately dragged away from that centre in order to make our measurements more sensitive to astigmatism, an off-axis aberration which increases with the removal from the frame centre. Lenses with good astigmatism correction will have low level of that aberration even in the distance of 10-20% from the frame centre; lenses which don’t correct astigmatism so well will show a significant level of that aberration even very close to the centre.
In the case of the Voigtlander Color Skopar 20 mm f/3.5 SL II Aspherical lens test, which is going to be discussed in this article in more detail, we used two of our biggest charts. The smaller ones were simply too small to be used in the test of a lens with such a wide angle of view.
After positioning the chart, the camera with the tested lens and constant lights in the right places we start our testing session. At every aperture available we take from 5 to 30 photos. Their number depends on the depth of field of the tested instrument. In the case of lenses featuring autofocus the front or back focus tendencies are checked first, then we calibrate the lens and only afterwards we use it in our test. Even so, half of the overall number of photos at every aperture is shot using the manual focus so we can avoid any potential autofocus errors.
The photos are always saved in two formats: RAW and JPEG. RAW files are later developed without sharpening by the dcraw program and saved as TIFF or PPM. Their further analysis is done by the Imatest program, which allows us to determine MTF50 function values.
It’s worth mentioning here that, although the MTF50 value we call often resolution it is not identical with the classic resolution definition. MTF50 determines rather total image quality as it includes information about the overall and particular contrast of a photo. If you really wanted to talk about resolution you should use the MTF30 parameter (or something near it) and if you wanted to talk about the general contrast, you should use values in the proximity of the MTF80.
The next thing we should keep in mind is the fact that the MTF50 value is not the result of the performance of a lens itself but that of the sensor-plus-lens set. The resolution values, reached in tests, depend on what detector the test was conducted.
The work on unsharpened files is the crucial thing for us. Sharpening is a partially unpredictable process and it doesn’t contribute to the optics tests, quite the opposite - it obscures the real picture; we are going to find out how in a moment.
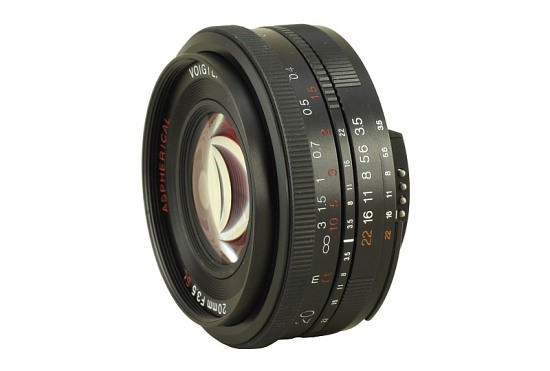
Voigtlander Color Skopar 20 mm f/3.5 SL II Aspherical lens |
A full frame test we often conduct with the help of the Nikon D3x. Exactly that camera was used in the Voigtlander Color Skopar 20 mm f/3.5 SL II Aspherical lens test. The camera features the 35.9×24.0 mm sensor containing 24.5 million pixels (6048x4032). We must emphasize here that it is a sensor with a Bayer filter, in which one pixel records light only in one precise sensel, hidden behind the filter of the given colour. Only an RGGB cell, with a dimension of 2x2 pixels, is completely sensitive on the intensity and the colour of light. I think I don’t have to prove that such a sensor is not able to separate over 4000 lines because it would mean that each and every one of its pixels worked effectively.
Of course it is not the case. When we work on RAW files, developed without any sharpening, the highest MTF50 values, attainable on the D3x, reach 47 lpmm- it means 2250 LWPH as it can be easily calculated. Such a value is safely far away from 4032 pixels, the height of the full frame Nikon’s D3x frame. Why that safe distance is important? Let’s look at the MTF graph of the Voigtlander 3.5/20 stopped down to f/8.0 (the vertical border between black and white).
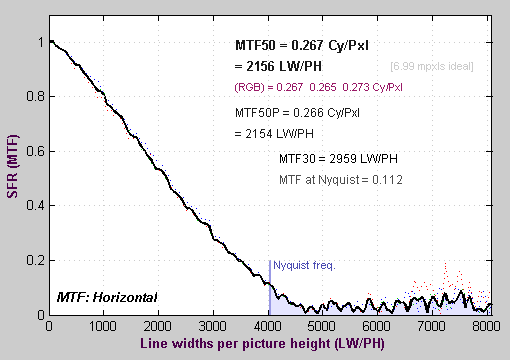 |
The MTF50 value reaches here almost 45 lpmm so near 2150 LWPH. When we consult the MTF30 value, though, which is closer to the classic resolution definition, we are coming to almost 3000 LPWH so the value in accordance with our intuition when it comes to a detector of this type. Dividing about 3000 lines by 4032 pixels is possible with good interpolating processes, working on RGGB-type pixels.
It’s worth mentioning that in our tests we always take our measurements on vertical and horizontal borders of white and black. In our opinion it is necessary because we must take into account one of the basic off-axis aberrations optical constructions have to correct – astigmatism. This aberration is responsible for the fact that images of black-and-white, perpendicular borders can give different profiles and therefore show different resolutions.
Let’s check the situation in the case of the Voigtlander Color Skopar 20 mm f/3.5 SL II Aspherical. On the graph below you can see the MTF50 values the lens reached in our test, separately for vertical and horizontal borders.
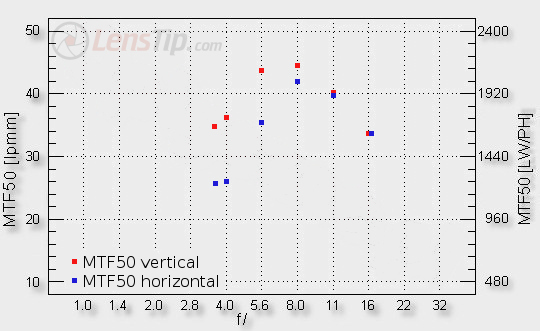
As you can notice the astigmatism of the tested lens is huge but it behaves perfectly according to the rules at the same time – decreasing when you stop down the aperture.
If we work out the average results, the final resolution graph in the frame centre, which we can present in our test, looks like that:
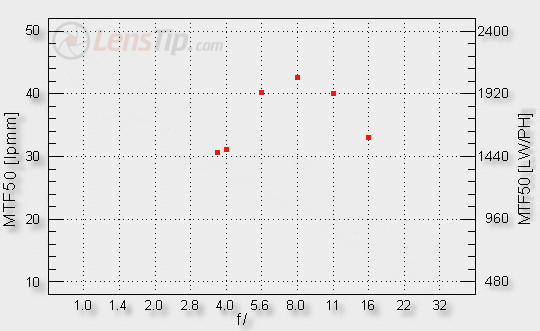
We would like to quote here what we wrote in the Voigtlander test under the resolution graph:
Near the maximum relative aperture, so by f/3.5 and f/4.0, the lens has results a bit above 30 lpmm, exceeding slightly the decency level which, in the case of tests performed on the Nikon D3x, is positioned near 30 lpmm. It would be difficult to criticize the tested lens here but, remembering its rather average fastness, we would like to see a bit better results. Actually better results are obtained but only on further stopping down of the aperture. By f/5.6 we see very good achievements because MTF50 function values, measured by us, reach even 40 lpmm there and by f/8.0 –almost 44 lpmm. Here the lens should be praised for the performance although it doesn’t break any resolution records. You must be sensible, after all – demanding records from such an untypical lens would be rather foolish.
Let’s leave our test now and try to make an experiment, pretending we are in the shoes of a tester from other editorial office. First, have a look at the results published on Photozone, reached using the Nikon D3x. It was a huge surprise for me when I saw what MTF50 values were given there. The sharpest lenses don’t have any problems with exceeding the level of 4000 LWPH. For example the Nikkor AF-S 200mm f/2 G ED VR by f/2.8 came to 4076 LWPH and the Nikkor AF-S 70–200mm f/2.8 G ED VR II at 70 mm and by f/4.0 had the result of 4028 LWPH.
It is strange for more than one reason. Firstly, as we already mentioned before, the MTF50 don’t correspond exactly to the classic resolution definition. When we start to think about the possible level of MTF30 values (and we are going to find out about it in a moment) if the MTF50 is placed near 4000 LWPH Mr. Harry Theodor Nyquist will remind us that our sensor is only 4032 pixels high.
Secondly, the presented MTF50 value is a result of the performance of the lens plus camera set – it is calculated by multiplying the MTF of the lens by that of the sensor. If the lens was simply perfect its MTFs in the wide range of frequency would get the value of 1.0. As none of the lenses, tested by Photozone, is perfect, its MTFs are lower than 1.0. If we want to find out the MTF of the sensor alone, we have to divide the ultimate MTF value of the lens-and-sensor set by something less than one (so multiply by something higher than one). It makes the MTF of the sensor higher or the same as the MTF of the lens-plus-sensor set. If the MTF50 result of the lens-plus-sensor set amounts to 4076 LWPH it means that the MTF50 value of the sensor itself is at least as high, and probably even noticeably higher. The same is true for the MTF30.
Let’s get down to the facts now. At the beginning of this article we used a RAW file from the Nikon D3x and the Voigtlander 3.5/20 set by f/8.0; we developed it using the dcraw program without sharpening and we calculated MTF50 values, amounting to 2156 LWPH. Now we are using the same file for the second time; we develop it with Adobe Lightroom, setting the sharpening on such a level so our results are similar to those we see on Photozone. As the Voigtlander doesn’t break resolution records there we tried not to exceed the level of 4000 LWPH. As a result the MTF function graph for the described photo can be seen in the picture below.
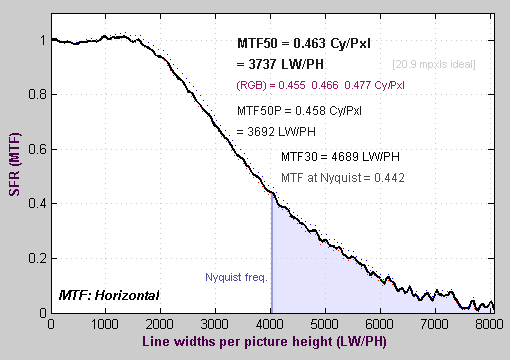 |
As you can notice the sharpening processes work in a very clever way. The contrast exceeds 100% just slightly so there are no annoying borders on black-white edges. The results of sharpening are easy to spot, though, especially if you compare the graph above to the graph of the unsharpened file. Apart from exceeding a bit the level of 100% we deal here also with a very high Nyquist Frequency response, as much as 44.2%; what’s more, the MTF50 and MTF30 values defy laws of physics amounting to 3737 and 4689 LWPH respectively. Especially the latter result is painfully illogical as it suggests that you can divide 4689 lines on 4032 pixels.
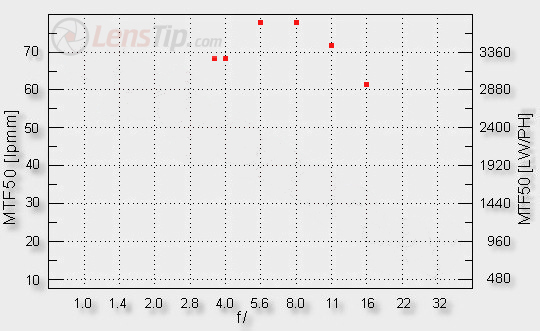
Let’s continue our game, impersonating the tester from other editorial office. We are developping other files from our test the same way, with the same level of sharpening (for all other aperture values), we are measuring MTF50 values only for vertical white and black borders and then the results are presented on the graph below.
To ease the comparison a bit let’s put together on the same graph the results based on sharpened files (red points), not taking into consideration the astigmatism influence, and the same files but unsharpened and considering astigmatism (blue points).
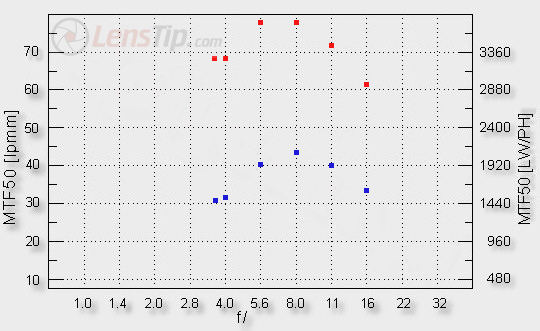
The differences are visible to the naked eye. The function graph with red dots will be far more appreciated by the tester than the blue graph, mainly because the difference between the maximum relative aperture performance and the results reached by f/5.6–f/8.0 is slight, amounting here to a dozen or so percent only. In the case of the performance based on unsharpened files that difference is nearly 50% so the assessment of the optics must be harsher but closer to the reality at the same time.
The graph above shows one more interesting issue – the differences between results obtained by particular apertures tend to get blurred when we don’t take into account the astigmatism and we sharpen the files. It can be noticed very well by f/5.6 and f/8.0 apertures – on sharpened files they show the same MTF50 values and on unsharpened files they differ visibly.
In this place we can support our train of thought by an experiment we made testing the Canon EF 85 mm f/1.2L II USM. Just a moment ago we wrote about the influence of sharpening and the astigmatism on the results of tests but in the case of the Voigtlander 3.5/20 it was difficult to differentiate between the influence of each of these factors. The experiment performed during the Canon 1.2/85 test shows us the influence of sharpening unambiguously.
Let’s look at the resolution graph of the Canon EOS 20D plus EF 85 mm f/1.2L USM set, obtained as a result of analyzing unsharpened RAW files (red points) and sharpened JPEG files (blue points).
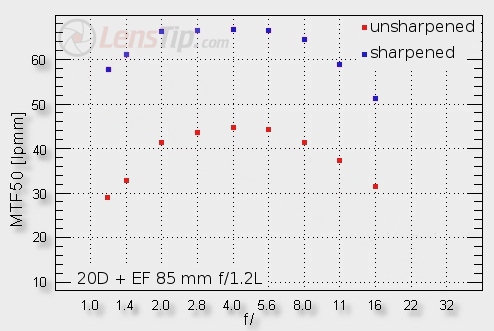
We look at exactly the same performance we saw before. Sharpened files give results on the level of 66 lpmm so 2000 LWPH- these are values completely defying laws of physics if you take into account the fact that the 20D sensor is only 2336 pixels high. What’s more we can observe an almost complete flattening of the graph in the most interesting range. Please, notice that the values ranging from f/2.0 to f/8.0 are, within the margin of error, exactly the same. It’s not the end of it, though. Sharpening is non-linear, improving weak images more than good images. The graph based on sharpened files shows a splendid performance at the maximum relative aperture, only worse a bit over 10% than the maximum results. In reality that difference amounts to almost 50% - such conclusion could be drawn when you consult the RAW-based test. It shows clearly what trust you can have in tests based on sharpened files and/or those saved in JPEG format
At the end I would like to address the green text, which appears in lenses’ tests published on the dpreview web portal. Let’s remind what I wrote about it in our FAQ section:
It is also worth noticing that many magazines and rival websites lack professional, scientific background when it comes to optics tests so it happens they don’t understand the results they deal with. That’s why you can see e.g. distortion tests depending on aperture, which some time ago could be admired in one of Polish photography magazines and now they are also published on one of Polish Internet sites. That’s why the dpreview.com publishes lens tests’ results in which practically every device reaches MTF50 values exceeding Nyquist Frequency for many aperture/focal lengths combinations. Such values are against the laws of physics and they are a result of analyzing oversharpened files. The commentary, added by the dpreview.com under MTF50 values graphs in green, tells us that “whenever the measured numbers exceed the Nyquist Frequency value it simply indicates that the lens out-resolves the sensor at this point”. It is a proof that somebody, who tests optics there, doesn’t understand the subject completely and is rather incompetent. The MTF50 value, measured as it should be done – using unsharpened RAW files and combining MTF’s of a lens with those of a sensor - cannot be higher than the Nyquist Frequency of the sensor itself.
I wanted to elaborate on that but I was surprised that both the green commentary and the Nyquist Frequency level marks on graphs have disappeared from the dpreview website. Interesting thing, it happened shortly after the translation of our FAQ section into English and publishing it on the LensTip.com. I don’t doubt our Readers can draw appropriate conclusions.
To tell you the truth, after looking closely at the results got on different bodies and published by dpreview, I think I know what was the source of their mistake. I am more inclined to concede that they really conduct tests on unsharpened files but they’ve made a small error, rather painful when it comes to the consequences. They calculated the Nyquist Frequency which was simply two times lower than it should. With such a low value, small wonder all lenses managed to exceed it but it also resulted in disconcerting the editors and creating the green commentary. When they noticed the mistake the commentary and the Nyquist level on graphs both disappeared.
By the way a very similar slip-up was made by the Photozone web portal, mentioned earlier in our article. When testing the Voigtlander 1.4/58, they put such a text in a red frame:
Some keen users may note that the LW/PH figures exceed the resolution of the sensor and as such Nyquist – see this document (bottom) for more details about the procedure if you’d like to dive into this. Imatest can look a bit beyond the sensor resolution by taking some additional parameters into account.
The funniest thing is that in the linked Imatest document we can find something totally opposite to that suggestion, written by Photozone testers. Let’s quote the Imatest author, straight from the linked document:
Sensor response above the Nyquist frequency is garbage. It can cause aliasing, visible as Moire patterns of low spatial frequency.
I am sure you can draw conclusions from this on your own.
At the very end we would like to emphasize that the lack of sharpening, so severely observed in the case of our tests and sample shots, doesn’t mean that the Lenstip.com editors always prefer, as photographers, unsharpened photos. In tests we must remove all factors that might disturb measurements and cause errors ; there’s really nothing wrong with sharpening a shot during later processing. Of course it is a separate topic, definitely outside the scope of this article.


